
Client user guide
Starting the application
The windows version of the client can be started by double-clicking the vis icon in the installation directory. For faster access to the application it may be useful to create a shortcut either on the desktop, or on the start menu.
The GNU/Linux version can be started by entering "go.vis". This requires /usr/local/bin to be in your path, however that is the case in many situations.
When the application starts, you will be presented with a control window containing numerous menu items and fields. From here you can configure the software, connect to different servers, build, and modify a representation of your real network. It also allows you to communicate with other users who are operating in the same environment for collaborative purposes.
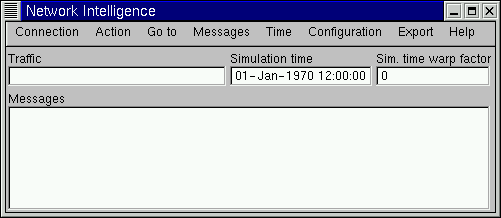
Configuring the client settings
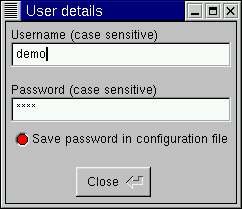
A form of CHAP (challenge handshake authentication protocol) is used to authentication client connections made to a Network Intelligence server. The client must be configured with a valid username and password and this can be entered in the configuration->user details window. In order to save entering this data every time the client is run, there is an option to save the details into a configuration file. In most cases it is a good idea to use this option.
The access_control program is used on the server to create a password file containing valid users, their passwords, and access level. The client username and password must match with an entry from this password file.
Note that these usernames are not related to the UNIX Operating System usernames or the /etc/password file.
Connecting to a Network Intelligence server
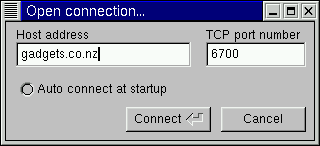
To connect to a server, select connection->open.... You will be presented with a window where you may specify the name of the Network Intelligence server to connect to and the TCP port to connect on. Either a fully qualified domain name (FQDN) may be entered for the name, or an IP address. The default TCP port for Network Intelligence servers is port 6700. Use this unless you know the server is on a different port. A radio button option to automatically connect at startup is available. This is useful when you mostly connect to the same server each time to run the client.
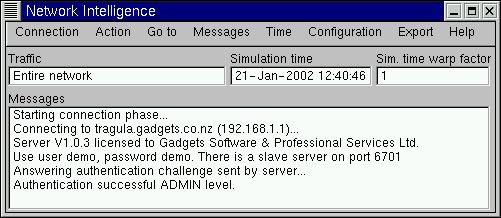
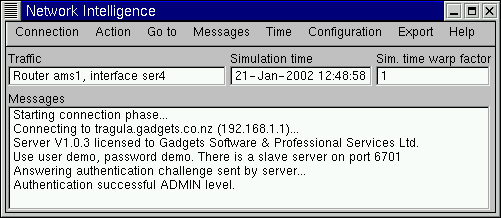
After clicking connect the client will attempt to connect to the server. If there is a problem, you will receive an error message. This may take a few seconds if there is a timeout, or it may happen immediately if something obvious is wrong. Details of any problems will be displayed in the messages box on the main window. Incorrect username/password pairs will be identified as such, as will any attempts to connect to servers that do not exist, incorrect server names etc.
If you have persistent problems connecting to a server and you cannot figure out where the problem is, try telnetting from the client machine to the server. Most telnet commands allow you to specify the port number on the command line. If you wanted to test the connection to the server at gadgets.co.nz on port 6700 you would enter the following under UNIX.
[martin@butzi martin]$ telnet gadgets.co.nz 6700 |
The response should be something like:
Trying 127.0.0.1... Connected to butzi (127.0.0.1). Escape character is '^]'. VERSION;0.01;Unregistered demo evaluation MESSAGE;BROADCAST;This is the message of the day. AUTHENTICATION;CHALLENGE;O4P1qvofnUGJ0FOY Connection closed by foreign host. [martin@butzi martin]$ |
The important thing to look for here is any sort of text coming back from the server. If you see lines with VERSION, MESSAGE, AUTHENTICATION etc. it confirms the underlying network between the client and the server is working. If this is the case, any problems you experience will be related to the Network Intelligence software. Check your usercode and password again. If you still cannot figure out what the problem is, you should drop us an E-Mail so that we can help you further.
If you do not get any of the text shown above, there is a problem at a lower layer in the network. Maybe there is no network connection between the client machine and the server, or a firewall is blocking the traffic. It's also possible the domain name resolution is not working properly on the client machine. An exhaustive list of possibilities is beyond the scope of this article and resolving the problem is left as an exercise for the reader.
In most situations the connection will work first time, and you will receive an "Authentication successful." message in the messages window. This means a successful connection between the client and the server has been established.
The 3D display
After connecting successfully to a server, the client will open a new window on the desktop. What you see in the window will depend on the state of the network as represented on the server.
The three dimensional environment is very similar to that used in many popular games such a Doom, Quake etc. In such an environment the user may move around and interact with objects inside that environment. All this is accomplished using the mouse and the control key on the keyboard.
For a server that has no network presently defined you will see only green ground and black sky. The default bahaviour of the client is to include a certain amount of fog. This will give a somewhat cloudy appearance to distant objects, so don't be alarmed if your horizon does not form a sharp ground/sky transition, but rather a fade to black effect.

Objects used in Network Intelligence
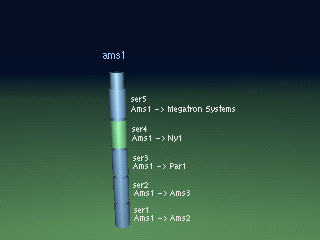
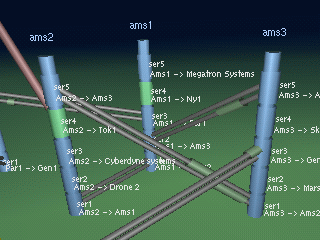
A network is represented using a few basic building blocks. The most basic is the router chassis. These are represented by vertical blue bars that look like batons.
Interface objects can be added to the basic router object. These correlate to router interfaces such as Serial4/4/0, Eth5 etc. and appear as segments making up the vertical body of the router. If an interface is exporting Netflow Exports, it will appear green, otherwise it will appear the same blue colour as the router.
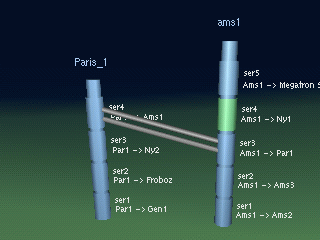
Router interfaces may be connected to each other by a circuit. These look like pipes and are grey in colour. They are unidirectional, so in order to represent a bi-directional circuit two pipes are used, one in each direction. Traffic flow along such a circuit is represented by a coloured packet that moves slowly along the length of the circuit. The size of the packet in relation to the length of the pipe represents the utilisation of the circuit. Packet flows are typically displayed in green however if the utilisation warning threshold of the circuit is exceeded, they will be displayed in red. It is possible to manually set the utilisation warning threshold of any circuit manually.
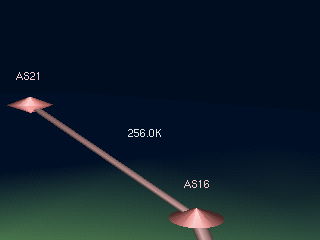
Autonomous Systems are represented as double-cone shaped objects that look similar to a childs spinning top and are salmon in colour. These are used to represent the other networks making up the Internet.
Traffic flowing away from the network being measured is represented by salmon coloured pipes. The diameter of these represent the size of the flow. Additionally the current flow rate is displayed numerically alongside the flow in bps, Kbps, or Mbps depending on the traffic volume. A traffic flow may connect a router interface to an adjoining Autonomous System (AS) or may connect two ASes together. They represent the volume of traffic from your network towards the other ASes. Due to the uni-directional nature of Netflow Exports there is no way to know the incoming traffic flows from each of these ASes.
Adding objects
There are two ways to add routers to the environment. They can be imported from router configuration files obtained directly from the routers themselves, or they can be built by hand. Importing is the easiest and fastest way of building a network as the router object and all interfaces are created at once. Performing the same task manually is laborious by comparison.
You can import routers into the environment by selecting action->add/edit->router (import)... from the menu. A window will appear with the names of all of the files in the router configuration directory on the server. These files should contain the configurations of each of your routers. They define how the network is connected, and Network Intelligence uses them to build a network representation, with router names, interface names, link speeds, IP addresses etc.
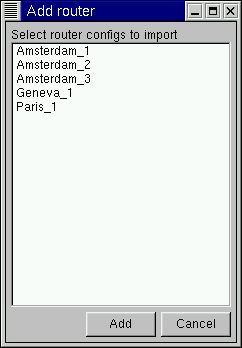
Single click to select a single router to import. Multiple routers can be quickly loaded by using shift-click to select a range, and ctrl-click to toggle a single router. After clicking on add the configurations for the selected items will be parsed and the new objects should appear at the origin of the 3D environment. That is location X=0, Y=0, Z=0. When a client connects to a server, the initial location and direction of the user are such that objects located at the origin will be visible.
Routers can be added manually by selecting action->add/edit->router... from the menu. A window will open where you can enter a name for the router, the loopback address and the IP address of the collector this router is exporting Netflow Exports to. Click add and the router will be added to the environment. It will be placed on the ground in front of wherever you are currently looking.

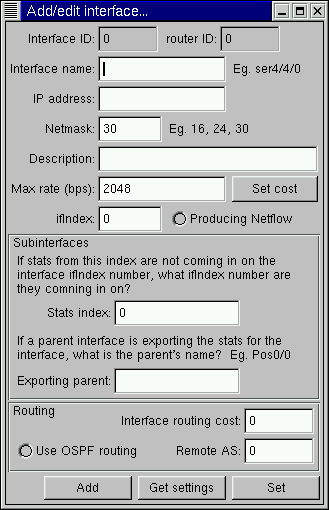
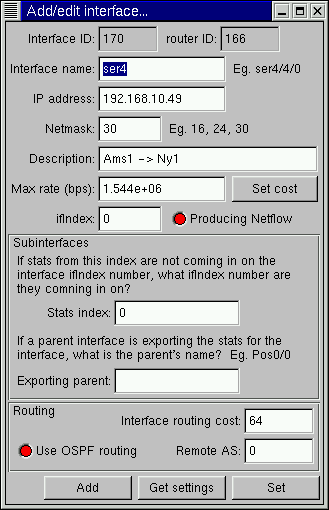
Interfaces can be manually added to routers. First select the router, then choose action->add/edit->interface... from the menu. A window will open with all of the parameters for an interface. You can specify values currently used by your routers, or enter different values if you wish to simulate a different network. Click add to have the interface added to the currently selected router.
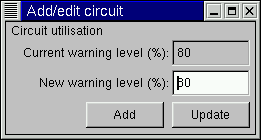
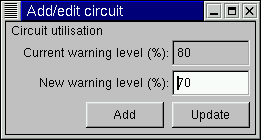
Circuits between two router interfaces can be manually added by first selecting the two interfaces in question, then by selecting action->add/edit->interface... from the menu. A window will open where you can manually define the utilisation warning level. Click add and the circuit will be added. The direction of the circuit (since circuits are unidirectional) will be from the first interface selected to the second interface selected.
There is no ability to manually add AS objects. These are created automatically by Network Intelligence as and when they are required.
In order to save time spent creating circuits between routers, Network Intelligence includes a connection discovery feature. This matches up interfaces on different routers based on the IP address and automatically creates the associated circuits. To make use of the feature first select at least one router, then choose action->connection discovery from the menu. As the interfaces for each router are scanned and matched a message will be displayed in the main Network Intelligence window. New circuits are created with a default utilisation warning level of 80%. Performing connection discovery on a large number of routers in a large network can be quite slow. Please be patient.
Selecting objects
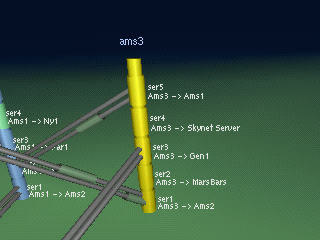
In order to interact with the environment it's necessary to be able to indicate which objects you wish to manipulate. Use CTRL-LMB (the control key in combination with the left mouse button) for this. Click on the objects to select in the 3D window. When you select an object with CTRL-LMB it will turn yellow to indicate that it is selected. Multiple objects may be selected by clicking (CTRL-LMB) on each object in turn.
To select an entire router, click on the top-most part of it. Clicking on any other part of a router will result in an interface being selected.
To clear the list of currently selected objects click (CTRL-LMB) on the sky or ground.
For a quick way to select a large number of routers or ASes select action->select... from the menu. A window will open with a list of all of the routers and ASes contained in the present network. Here you can choose multiple items and then click select. The selected items will turn yellow in the 3D window.
Selected items may subsequently be manipulated using the options on the action menu.
Manipulating selected objects
Once an object is selected you can manipulate it. The action menu items offer a variety of functions including the ability to edit, move and delete objects.
Connection discovery is a particularly interesting feature and is extremely useful when building a network model. Connection discovery uses the configuration of the actual router to calculate where it is connected into your network. This saves you the tedious and error-prone job of working it out by hand.
The ability to edit the network is very useful for testing out simulated changes.
To edit a router, select the action->add/edit->router... option. The get settings and set buttons work with a single router so select a single router and click get settings. The current values for that router will be displayed in the window. Edit them if you like, then click set to save the new values.

Editing an interface using the action->add/edit->router... option works in the same way as editing a router, but you must select a single interface to work with.
Editing circuits is a little different from editing routers and interfaces. Begin by selecting the action->add/edit->circuit... option. A window will open. Now select a single circuit. The present utilisation warning level will appear in the circuit edit window. If you wish you may select a new warning level and click the update button to set the new value. You may update multiple circuits at once if you select multiple circuits before clicking update. Note that if you have multiple circuits selected, the current warning level displayed will be that of the circuit you selected first.
Moving objects
There are two ways to move objects. An interactive move allows objects to be moved on the horizontal (XZ) plane, whereas a menu option allows objects to be moved along the vertial (Y) axis.
To move objects horizontally on the XZ plane first select one or more objects. Now drag them using CTRL-RMB (right mouse button). Move the mouse and the objects will follow. Mouse sideways movement moves the objects sideways, and mouse forward and backward movement moves the objects away or toward you. Release the mouse button to complete the move.
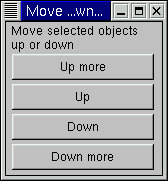
Moving objects vertically can be achieved with the action->move up/down... menu item. A window will open with a number of buttons that control the amount of up or down movement. All selected items will be moved according to the button pressed. It's not possible to move objects below ground level.
Auto placement
Manually placing individual objects can be a slow procedure. The auto arrange feature lets you position routers and ASes in a pattern that helps improve clarity.
Select the action->auto arrange option and you will be presented with a window that lets you specify the arrangement parameters.
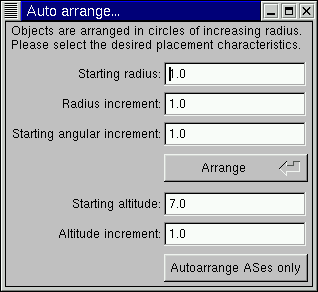
Two arrangement features are available. The first one is used for arranging routers. It works by arranging the devices in circles of increasing radius. This tends to group the routers together nicely while keeping some space around each one. The parameters allow you to alter the density of the placement of the routers.
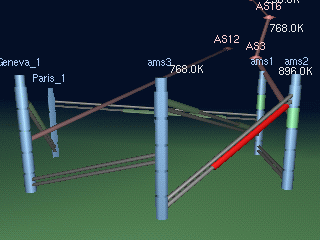
One technique for building a network is to move all the routers for a particular city to an empty area in the 3D environment, then to perform an auto arrange on just those routers. The result is a clumping together of geographically close routers.
The second option is used for placing ASes. In a typical carrier network there will be hundreds of ASes in the model. An easy way to arrange them is to first select all of the ASes using the action->select... option, then to use auto arrange. The AS placement auto arrange feature lets you specify starting altitude and incremental altitude. The ASes will be placed in circles of increasing radius as for the router auto arrange feature, but additionally they will be located at different heights. ASes directly connected to the network will appear at the lowest layer, while ASes further away (more hops) will appear at a higher layer.
Looking around
Looking around the environment is very useful. The left mouse button (LMB) is used to achieve this. Click and hold the LMB while the cursor is over an empty area of ground or sky. Your viewpoint will follow the mouse pointer, so moving the mouse forward or backward will cause you to look up or down. Looking to the left or right is achieved with sideways mouse movement. The control is proportional to the amount the mouse is moved. Releasing the button will halt all movement.
Moving about
Three forms of movement are available to the user. Each form is useful and helps to make visualisation of the network a breeze. Translation allows movement on the horizontal plane. Two forms of orbit allow movement around an object. The first maintains constant height of the viewpoint, while the second maintains constant distance from the object.
To translate, click and hold the RMB (right mouse button) over an emptry area of sky or ground. Pushing the mouse forward or backwards moves you forward or backwards in the 3D environment. The speed of movement is proportional to the amount the mouse is moved. Sideways movement is controlled by moving the mouse to the side. Once again, speed of movement is proportional to the amount the mouse is moved. This allows the user to move about anywhere on the XZ plane, and can be likened to walking around the environment. When you are finished moving, release the button and you will stop.
To orbit (pan) around an object, click the LMB (left mouse button) on a router or AS and while holding the button down, move the mouse. Moving the mouse sideways will result in you panning around the object while maintaining a constant distance. Moving the mouse forwards or backwards will move you nearer or further away from the object. Releasing the button will stop all movement.
To orbit around an object at constant distance, click the RMB on a router or AS and while holding the button down, move the mouse. Moving the mouse sideways will result in you panning around the object while maintaining a constant distance. Moving the mouse forwards or backwards will move up or down relative to the base of the object. Releasing the button will stop all movement.
Should you ever become lost in the 3D world it is useful to be able to get back to a known position. The go to->start location option will take you back to the place you were at when you first connected to the server. You will be facing the origin of the 3D environment where X, Y and Z are 0.
Graphs
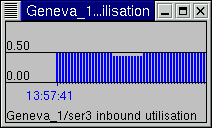
Graphs are usful for tracking changes in a variable (flow volume or circuit utilisation in the case of Network Intelligence). Two kinds of graph are supported. Window graphs appear on the desktop in a window of their own. They can be resized by the user, minimised and treated like any other window. The second style of graph is the 3D graph. This exists only inside the 3D environment, and will hover somewhere near the object being graphed.
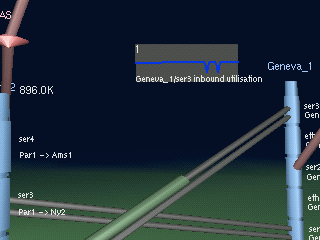
To create a graph, first select a single circuit or flow. Select the action->graph... option. A window will open with various fields that let you customise the graph.
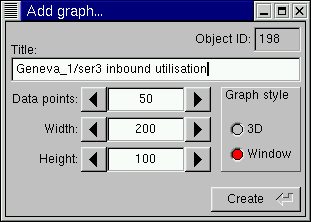
You can set the graph title, the physical size of the graph, and the number of data points to display. Each data point represents the traffic for the Update period presently set between the client and the server. The graph style radio buttons let you chose the style of graph (either window or 3D).
Time control
Seeing how network topology and traffic flows vary over time can be extremely useful. The time control features of Network Intelligence allow any histroic data to be replayed as dictated by the wishes of the user.
Time control in Network Intelligence is one of the more challenging aspects to understand completely. It is simplified greatly by understanding the underlying workings of the Network Intelligence system. It begins with statistics being gathered by collectors that are scattered around the network. These statistics can be considered as real-time, and are therefore valid only for this point in time, known as the present. The statistics are sent to a server which in turn populates a database with the statistics, along with a timestamp. The timestamp in this case being the present time. A server such as this, that collects statistics from the present and populates the database, is called a master server. There can be only one master server per database. The master server is the sole entity responsible for populating the database with data. It makes sence then, when a client connects to a master server, only the present network topology and traffic can be viewed. If we wish to view our network environment as it was some time in the past, we need to connect to a slave server. A slave server extracts information from the database, and produces a network environment for the client. The client specifies the timestamp of data they are interested in, and the slave server will retrieve this from the database. In such a way the user can review historic information, and can control the passage of time through history. It is possible to have any number of slave servers operating from a single databse, limited only by system resources. Setting up severs, whether they are a slave or a master, is part of the server documentation. Slave servers typically run on the ports following a master server. For example, a master server may be configured on port 6700, while slave servers may be running on ports 6701, 6702 and 6703.
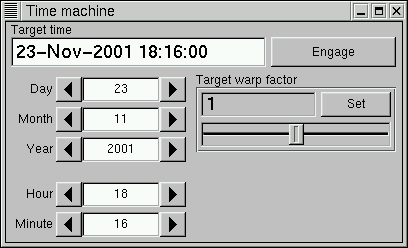
When connected to a slave server, an additional time->control... option appears on the menu bar of the client. Using this control it is possible to go back in time and view the network and associated traffic flows at some time in the past. It is also possible to set the speed at which time passes. This feature behaves like a time lapse movie, with the displayed network changing many times faster than real-time. It is even possible to run time backwards if the user so desires.
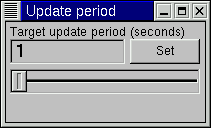
Update period
Accessed from time->update period..., the update period window allows the user to specify the interval between server to client updates. A very short update period will keep the client closely in sync with the server, at the expense of increased network traffic between the two. Event messages and warnings are sometimes sent every period as well, so short periods like one second are to be avoided unless the user chooses to be flooded with information.
Short intervals are useful however when displaying time-lapse views of the network. Consider the case where time has been accelerated so that one day passes in one minute of wall clock time. If the client is being provided with updates every minute, you will see a new snapshot of the network every minute, with each snapshot representing one day. If the update period is reduced to 15 seconds, time will still pass at the same rate of one day per minute of wall clock time, however you will receive four snapshots each minute, each one representing a different part of the day.
Traffic selection
When viewing the traffic flowing on your network, it is possible to view all of the traffic flows, or just the flows created by the traffic from one interface. Looking at one interface can give an excellent idea of where traffic from a peer is actually flowing!
The current setting is displayed on the main window, the default being to view all traffic flowing across the network. In order to view just the traffic coming in a particular interface, first locate an interface of interest. The interface must be one gathering Netflow Exports. Such an interface will appear green rather than blue.
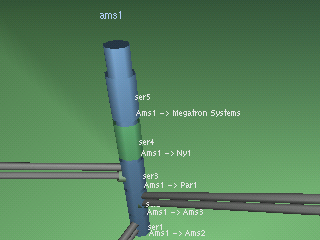
Select the interface, then choose the menu option action->view->single interface traffic. The traffic field on the main window will be updated to show which traffic is being viewed.
The three dimensional display will update accordingly showing the flows for all traffic coming in the selected interface.
Image snapshot
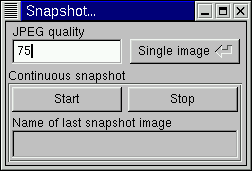
The image snapshot feature accessible from export->snapshot... allows you to create either single frame images of the network environment or sequential frame by frame images. Images created using the latter method can be combined using third-party software to generate a network animation.
A quality field enables you to set the compression level when saving the JPEG images. Larger values produce clearer images at the expense of increased disk space usage. After taking a snapshot the filename will be displayed for your information. All snapshot images are created in the working directory.
Messaging
A message broadcast system is included in Network Intelligence that enables users to communicate using text messages. This is useful for follow-the-sun applications where people using Network Intelligence may be located anywhere on Earth. Using the messaging system the network designers can easily keep in touch, can discuss network issues etc.
To send a message to other Network Intelligence users on the same server, select the messages->collaboration... option. A window will open that contains a history of messages received. One line will be available for entering a message to send, and it will be sent as soon as you hit the return key.
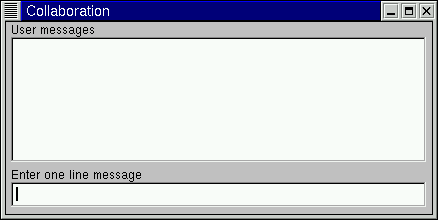
If you are running Network Intelligence with the collaboration window closed and somebody else sends a message, the collaboration window will open automatically and display the message.
© Gadgets Software 2001-2008